Materials Overage
Materials Overage compares what you bought for each job against what you budgeted on the proposal. It shows which projects went over, which materials did it, and whether the crew used more than planned or the price simply went up.
Who can see it: Owner/Admin and Manager only.
To open it: click Reporting in the menu, then Materials Overage. You can also click the Materials Overage tab at the top of the Command Center.
Where the Numbers Come From
- Budget is the materials on the accepted proposal: the quantity and the price at the time you sold the job.
- Actual comes from the purchase orders recorded against each material on the Project Budget page.
Purchase orders record a quantity, not what you paid. So actual dollars are the quantity bought times today's price in your Materials catalog. If the crew bought exactly what was planned but your supplier raised prices since the proposal, the material still shows dollars over. The drill-down labels those Price Increase, so you can tell them apart from real overuse.
Filters
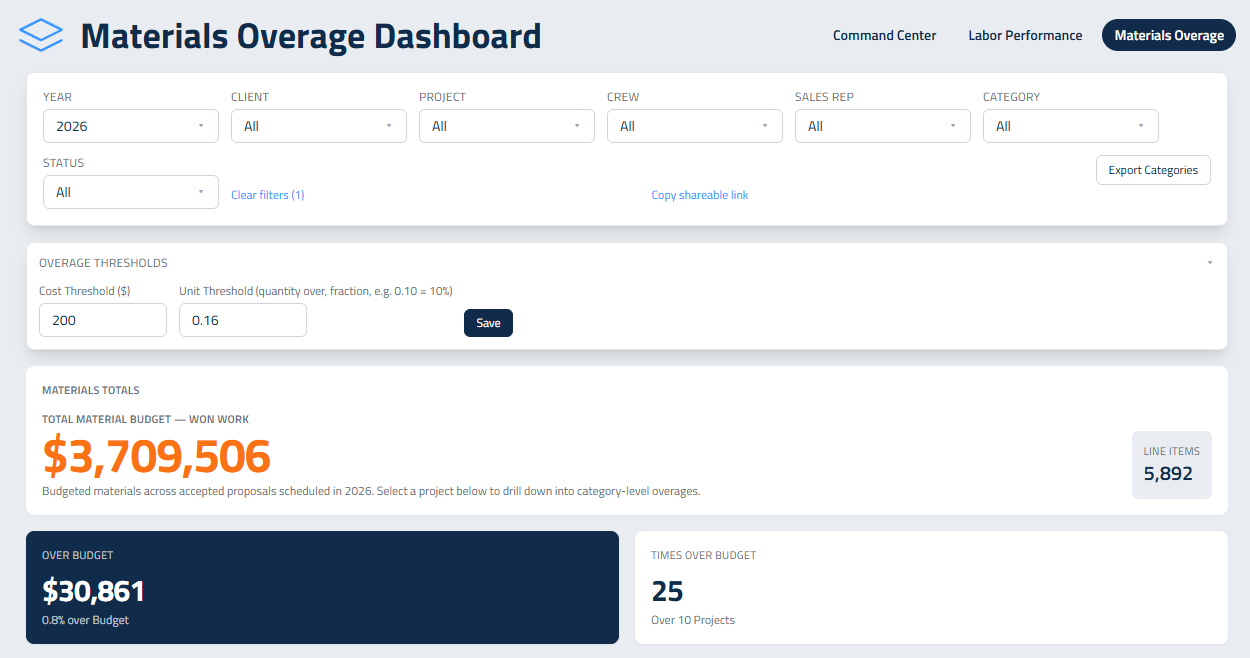
Narrow the page with Year, Client, Project, Crew, Sales Rep, Category and Status. Pick a client first and the Project and Crew lists narrow to that client. Year starts on the current year.
- Clear filters puts everything back.
- Copy shareable link copies a link to exactly what you're looking at. Whoever opens it still needs Owner/Admin or Manager access.
Overage Thresholds
Not every overage is worth your time. A bag of fertilizer over plan isn't a problem; a pallet of pavers is. The thresholds decide what counts as a significant overage.
A material is significantly over when either of these is true:
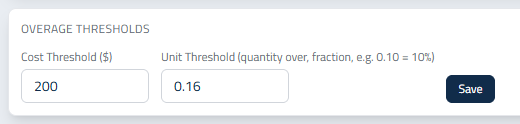
- Unit Threshold: the quantity bought is over plan by at least this much. Enter it as a fraction, so 0.10 means 10% over. The default is 10%.
- Cost Threshold ($): the dollars are over budget by more than this amount. The default is $200.
A material that wasn't on the budget at all is significant once it costs more than the Cost Threshold.
Click Overage Thresholds to open the panel, change either number and click Save. The thresholds apply to your whole company, and the page picks them up within a few seconds.
Materials Totals and the Top Tiles
- Total Material Budget: the budgeted materials on your accepted proposals scheduled in the year you picked.
- Line Items: how many material lines that budget is made of.
- Over Budget: the total dollars over budget and the percent over. Only categories that actually went over are added up, so one category coming in under doesn't hide another that ran over.
- Times Over Budget: how many materials were significantly over, and on how many projects.
Material Overage Cost by Project
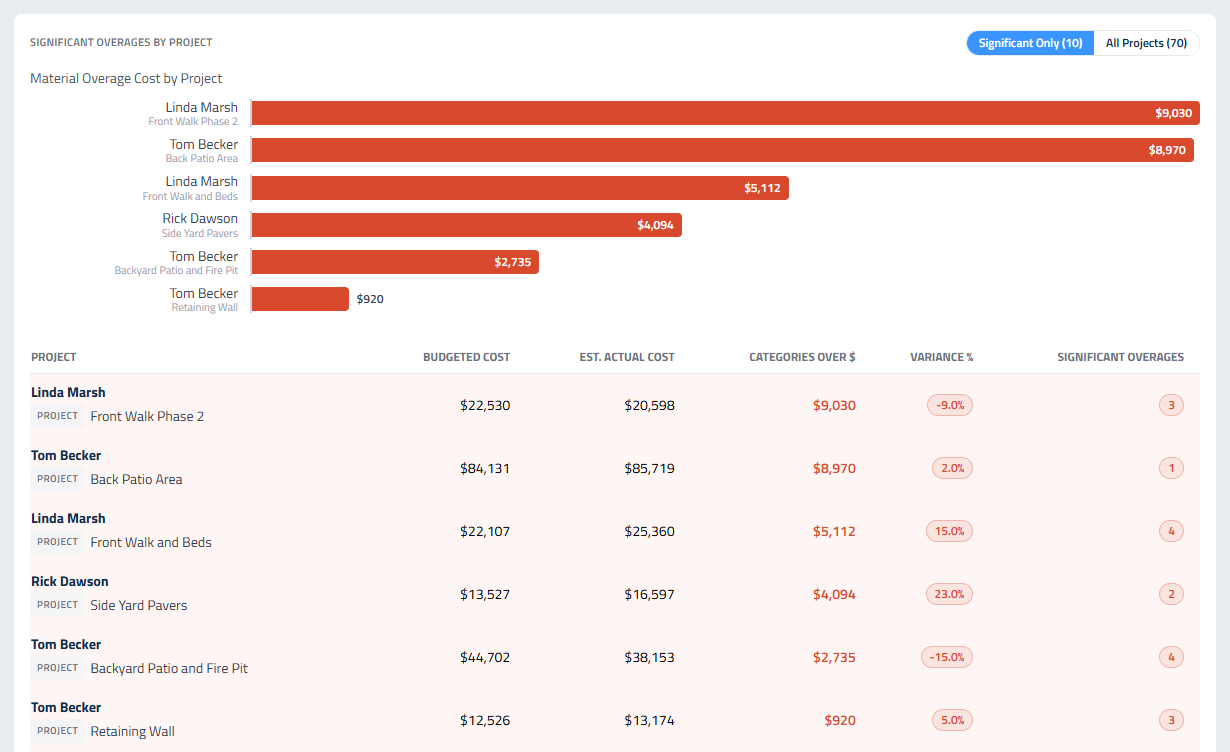
A red bar for each project showing the dollars over budget. Hover over a bar to see actual against budget. Click a bar to open that project's drill-down.
Significant Overages by Project
The table under the chart. It starts on Significant Only, the projects with at least one significant overage. Click All Projects to see everything.
Column | What it means |
|---|---|
Project | The client and project |
Budgeted Cost | Materials on the proposal |
Est. Actual Cost | Purchase order quantities at today's catalog prices |
Categories Over $ | Dollars over, adding up only the categories that went over |
Variance % | Total actual against total budget. Negative means under budget overall |
Significant Overages | How many materials tripped a threshold |
A project can be under budget overall and still have a category that ran well over. That's why Categories Over $ and Variance % can point in different directions. Click any row to open the drill-down.
Job Materials Drill Down
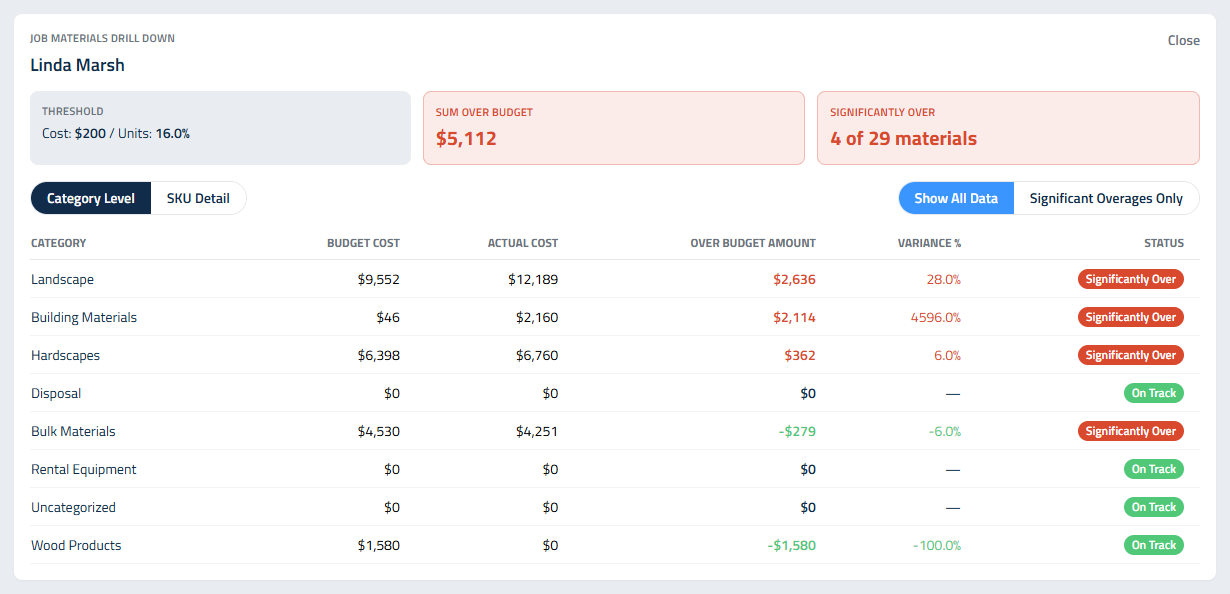
Everything about one project's materials. Across the top you'll see the Threshold in use, the Sum Over Budget, and Significantly Over with how many of the project's materials tripped a threshold. That box is green at 0, amber at 1 or 2, and red at 3 or more.
Choose your view
- Category Level or SKU Detail: totals by category, or every material on its own.
- Show All Data or Significant Overages Only.
- Section: pick one work area from the proposal, or leave it on All sections.
Overage Amount by Section charts the dollars over in each work area of the proposal. Click a bar to filter the tables to that section.
Category Level shows Budget Cost, Actual Cost, Over Budget Amount, Variance % and a Status for each category:
- Significantly Over: at least one material in it tripped a threshold.
- Price Increase: it tripped a threshold, but the quantities are on plan. The dollars are over because catalog prices went up since the proposal.
- On Track: nothing significant.
SKU Detail shows each material with Budget Qty, Actual Qty, Over Qty, $ Budgeted, $ Actual, $ Over and Variance %.
Click Close to put the drill-down away.
Export
Export Categories downloads your material spending by category: total cost, total quantity, and how many proposals and line items each category shows up on.
Getting Numbers You Can Trust
- Enter purchase orders as the materials are bought, not at the end of the job.
- Keep your Materials catalog prices current. Actual dollars use today's prices, so a stale catalog hides real increases.
- Set the thresholds to fit your work. If everything is flagged, raise them until the flags are the ones worth a phone call.
Updated on: 09/29/2026
Thank you!