Command Center
The Command Center is your business on one page. It shows how your crews are producing against your Profit Genie target, what you've sold this year, which invoices are waiting to go out, how full each crew's calendar is, and which jobs are eating through their budgets.
To open it, click Command Center at the top of the menu. It always shows the current year. There are no filters on purpose; when you want to dig into one client, crew or project, use Labor Performance and Materials Overage. You'll find both under Reporting in the menu, and as tabs at the top of the Command Center.
Who Sees What
Command Center | Owner/Admin | Manager | Estimator | Sales | Accounting | Foreman/PM | Field |
|---|---|---|---|---|---|---|---|
Command Center page | ✅ | ✅ | ✅ | ✅ | ✅ | ✅ | |
YTD Daily PMM tile | ✅ | ✅ | ✅ | ✅ | ✅ | ||
Gross Profit and GP Margin tiles | ✅ | ✅ | ✅ | ||||
Refresh data button | ✅ | ✅ | ✅ | ✅ | ✅ | ||
Labor Performance and Materials Overage | ✅ | ✅ |
Field sees the standard Dashboard instead. For everything else each role can do, see Users and Roles.
The Top Row
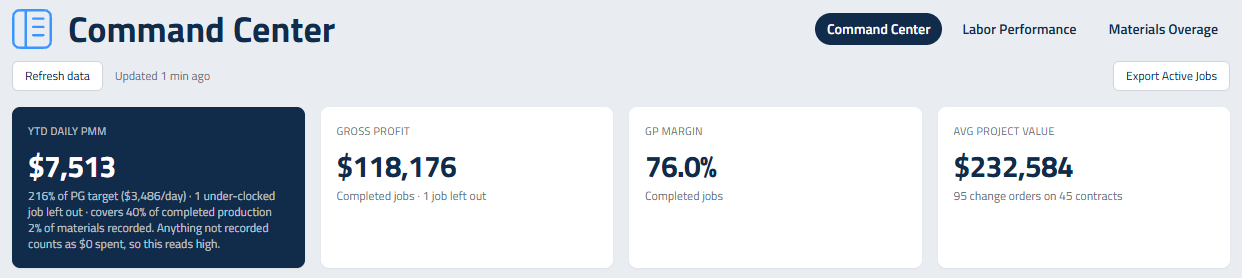
YTD Daily PMM What your company actually produces per day this year, based on completed jobs. It's worked out the same way as your Profit Genie target, so you can put the two side by side:
- Production on each job is the price minus the materials, equipment and subcontractors recorded on its Project Budget page. A job with nothing recorded uses its materials budget instead, so it doesn't look like its materials were free.
- That's divided by the days your crew really spent on the job (clocked hours divided by your hours per day), then scaled to your whole field team.
- Underneath, you'll see what percent of your Profit Genie target you're hitting.
A completed job only counts when it has a price and at least half of its budgeted hours were clocked. Anything that doesn't qualify is listed under the number as left out: unclocked (no hours at all), under-clocked (less than half the budgeted hours) or unpriced. Hover over that line to see which jobs. "Covers X% of completed production" tells you how much of your finished work the number stands on; the higher that is, the more you can trust it.
The last line tells you how much of those jobs' materials budget was actually recorded. Materials that weren't recorded count as $0 spent, so a low percent means the number reads high.
Until you have completed jobs that qualify, the tile shows your Profit Genie Daily PMM Target instead.
Gross Profit What you made on completed jobs this year: their prices minus the actual costs booked against them. It uses the same rule as the PMM tile, so a completed job counts once at least half of its budgeted hours are clocked and it has actual costs. Jobs that don't qualify are counted under the number.
GP Margin Gross Profit as a percent of the price of those same jobs.
Avg Project Value The average full value of a project you've won this year, change orders included. Underneath, you'll see how many change orders landed on how many contracts.
Invoicing, Sales & Pipeline
The wide panel under the top row has three columns.
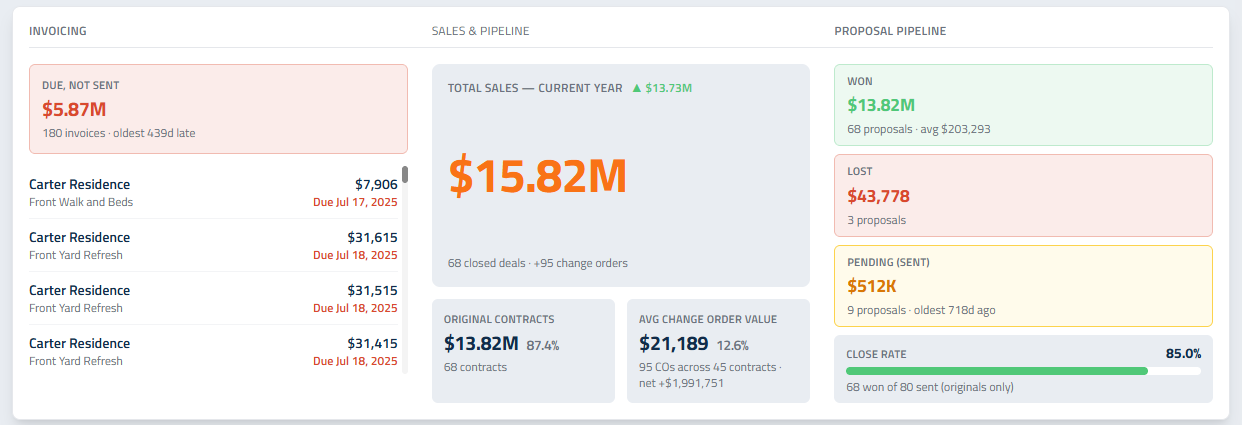
Invoicing: Due, not sent Draft invoices that are due today or earlier and haven't gone out yet. You'll see the total, how many there are, and how many days late the oldest one is. The list runs oldest first, with late dates in red. Click a row to open that project's invoicing and send it.
Sales & Pipeline
- Total Sales is every original contract you've won this year plus what change orders added. The green ▲ or red ▼ next to the title compares you to last year on the same date; hover over it for the details.
- Original Contracts shows what your original contracts are worth, their share of total sales and how many there are.
- Avg Change Order Value shows the average change order, the share of total sales that came from change orders, and how many change orders landed on how many contracts.
Proposal Pipeline
- Won (green): original proposals your clients accepted this year, with the count and average.
- Lost (red): proposals you've marked as rejected.
- Pending (sent) (amber): proposals out with clients and waiting on an answer, with how long the oldest one has been waiting.
- Close Rate: won divided by everything you sent (won, lost and pending). Only original proposals count; a change order isn't a new sale.
Crew Calendar Fill
One bar for each crew, in the crew's color, showing how much of your season is booked.
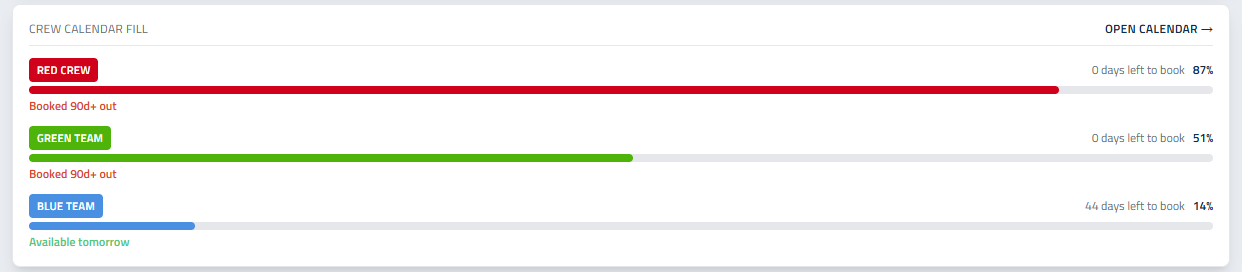
- Days left to book counts the weekdays from tomorrow to the end of your season that have nothing on that crew's calendar. Days already behind you don't count.
- The percent is how much of the whole season is booked.
- Under each bar you'll see Available tomorrow, Next open with the date and how many days away it is, or Booked 90d+ out when the crew has no open weekday in the next 90 days.
Use it when a client asks "when can you start?" The answer is right there.
Active Job Budget vs Actual
One card for each scheduled or in-progress job, with the client, the project and the crew. Unassigned means no crew is on it yet. Each card has three bars, actual against budget:
- Days on the calendar
- Labor dollars
- Materials dollars
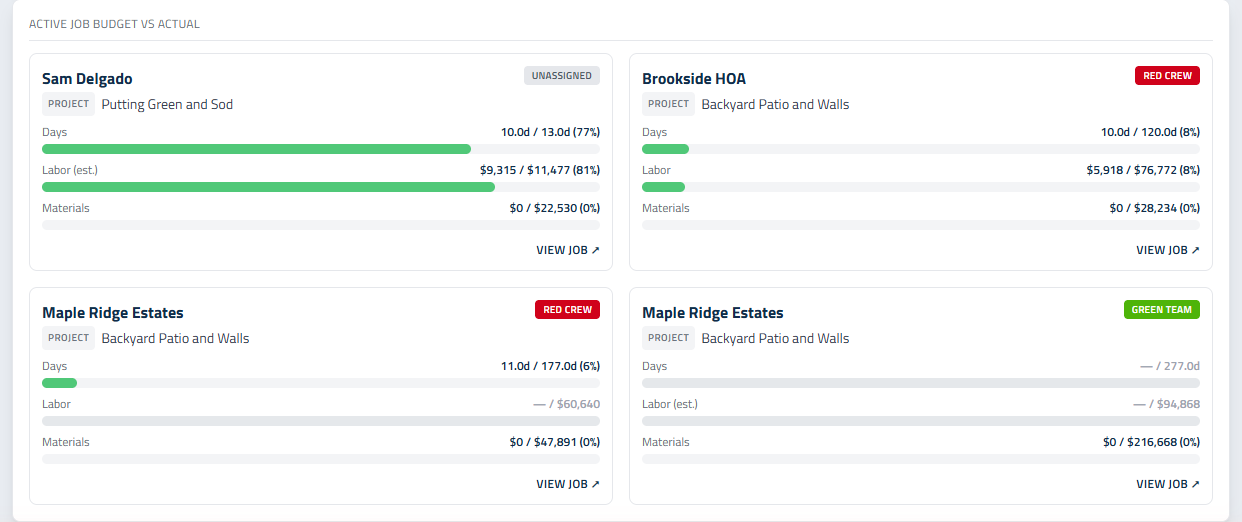
A bar stays green under 100% and turns red at or over budget. Labor (est.) means no crew is assigned yet, so the labor budget uses the proposal's average rate instead of the crew's. A grey bar with a dash means that cost can't be worked out for the job yet.
The jobs using the most of their budget show first. You'll see the top 6; click Show all for the rest. View job opens the job in a new tab.
Keeping It Current
- The Command Center updates itself every 5 minutes. The time next to the button tells you when it last updated.
- Refresh data updates it right away, which is handy just after you've entered time or accepted a proposal.
- Export Active Jobs downloads a spreadsheet of your active jobs: client, job, status, budget and actual days, hours, labor and materials, proposal price, gross profit and GP margin.
Getting Numbers You Can Trust
- Have crews clock in to the job, not only the day. Time on the global clock (clocked in without a job) never reaches a job.
- Make sure finished jobs are marked complete. YTD Daily PMM, Gross Profit and GP Margin only count completed jobs.
- Record your purchase orders on the Project Budget page so materials actuals show up.
- Assign a crew to every scheduled job, so labor budgets use that crew's real rates.
Updated on: 09/29/2026
Thank you!