Labor Performance
Labor is where most jobs make or lose their money. Labor Performance shows where your hours went: which finished jobs ran over, how much overtime you paid, how much time never got clocked to a job, and who clocked in somewhere they shouldn't have been.
Who can see it: Owner/Admin and Manager only. It shows each employee's hours and labor cost, and pay rates can be worked out from those numbers.
To open it: click Reporting in the menu, then Labor Performance. You can also click the Labor Performance tab at the top of the Command Center.
Filters
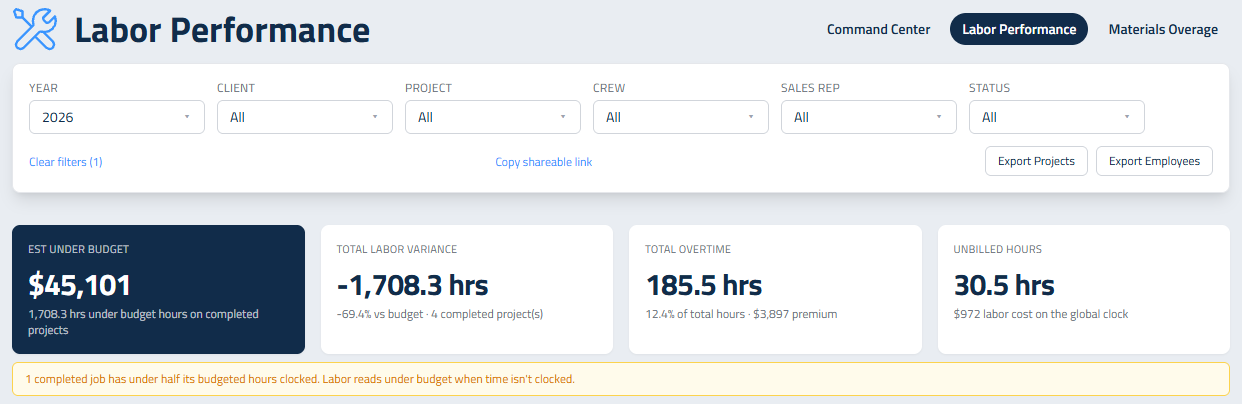
Narrow the page with Year, Client, Project, Crew, Sales Rep and Status. Pick a client first and the Project and Crew lists narrow to that client. Year starts on the current year.
- Clear filters puts everything back.
- Copy shareable link copies a link to exactly what you're looking at. Whoever opens it still needs Owner/Admin or Manager access.
The Top Row
Est Over Budget (or Est Under Budget)
What labor on your completed jobs cost against what you budgeted: each job's actual labor cost minus its labor budget, added up. Actual cost uses the rates your people clocked in at; the budget uses the assigned crew's current rates. It's the same number as the Labor Overage column below and the labor overage on the Command Center, so the three always agree. Underneath, you'll see the hours over or under budget, and when you're over, what that pace would cost over a full year of field labor from Profit Genie.
Total Labor Variance
Actual hours minus budgeted hours on completed jobs with timesheets, with the percent over budget and how many projects it covers. Jobs still in progress are left out, because half-done work always looks under budget.
Total Overtime
Hours worked over 40 in a week, the share of all hours that was overtime, and the premium it cost you.
Unbilled Hours
Time clocked on the global clock, meaning clocked in without picking a job, and what that time cost in labor.
Two amber notes can show up under the tiles:
- "X completed jobs have under half their budgeted hours clocked." Those jobs stay in the numbers, but time that was never clocked pulls them toward under budget. Get the hours onto those jobs and the figure corrects itself.
- "Only X% of logged field hours are clocked against a job." Most of your time is sitting on the global clock, so the per-project numbers are only seeing a small slice of the real work.
Timesheet entries under a minute or over 24 hours (a timer left running) are left out of everything.
Project Summary Actuals
One row for each completed job with actual costs booked, most profitable first.
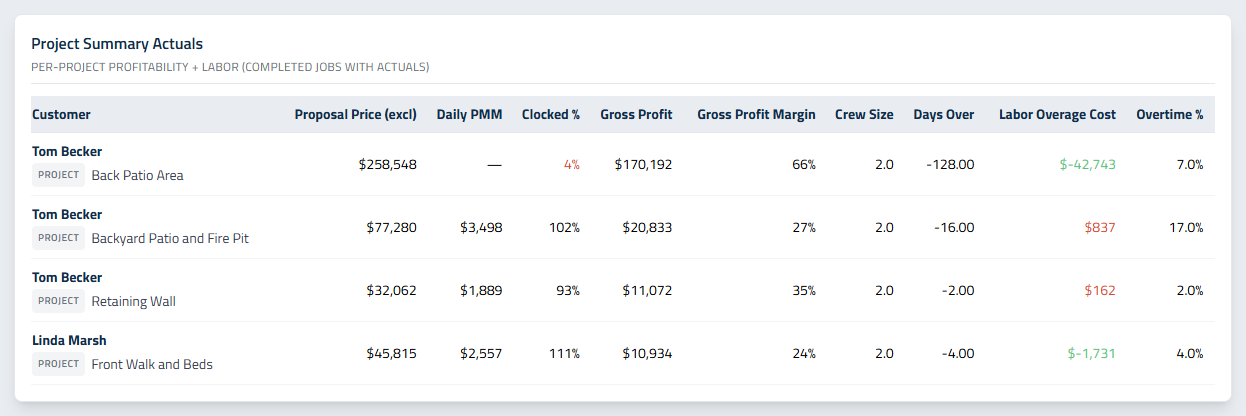
Column | What it means |
|---|---|
Proposal Price (excl) | The job price, not counting tax |
Daily PMM | What the job produced per day |
Clocked % | How much of the budgeted hours were clocked. Red under 50%, and Daily PMM isn't worked out for that job |
Gross Profit | Price minus actual costs |
Gross Profit Margin | Gross Profit as a percent of the price |
Crew Size | How many people were on the crew |
Days Over | Days past the budgeted days |
Labor Overage Cost | What the extra labor cost. Green when under budget |
Overtime % | The share of the job's hours that were overtime |
A dash means no timesheets were clocked to that job. Budget at estimate rate under a client's name means no crew was assigned, so that job's labor budget uses the proposal's average rate instead of a crew's.
Hours Over Budget By Project
A bar for each completed job with timesheets. Red bars to the right ran over; green bars to the left came in under. Hover over a bar to see budget and actual hours. The table under it has Budget Hrs, Actual Hrs, Hours Over, Overtime %, Labor Overage, Overtime Cost and Days Over for each project.
Look for patterns, not one-offs. If the same type of work runs over every time, your production rates for that work need adjusting.
Unbilled Labor Cost
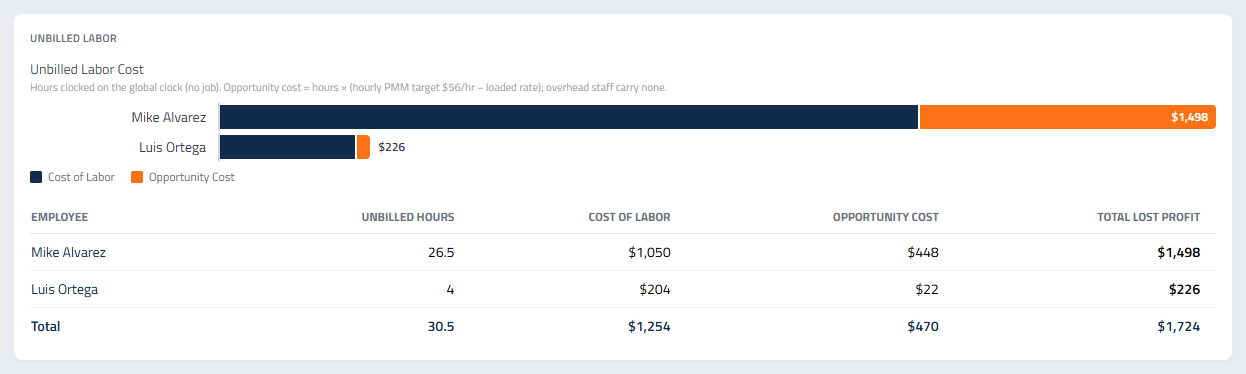
Time on the global clock, broken out by person. Each bar has two parts:
- Cost of Labor: the unbilled hours times that person's loaded rate. That's what you paid.
- Opportunity Cost: the unbilled hours times the gap between your hourly PMM target and their loaded rate. That's what those hours would have earned on a job.
The table adds them into Total Lost Profit. Overhead staff carry no opportunity cost, since their time was never meant to be billed.
Overtime Analysis
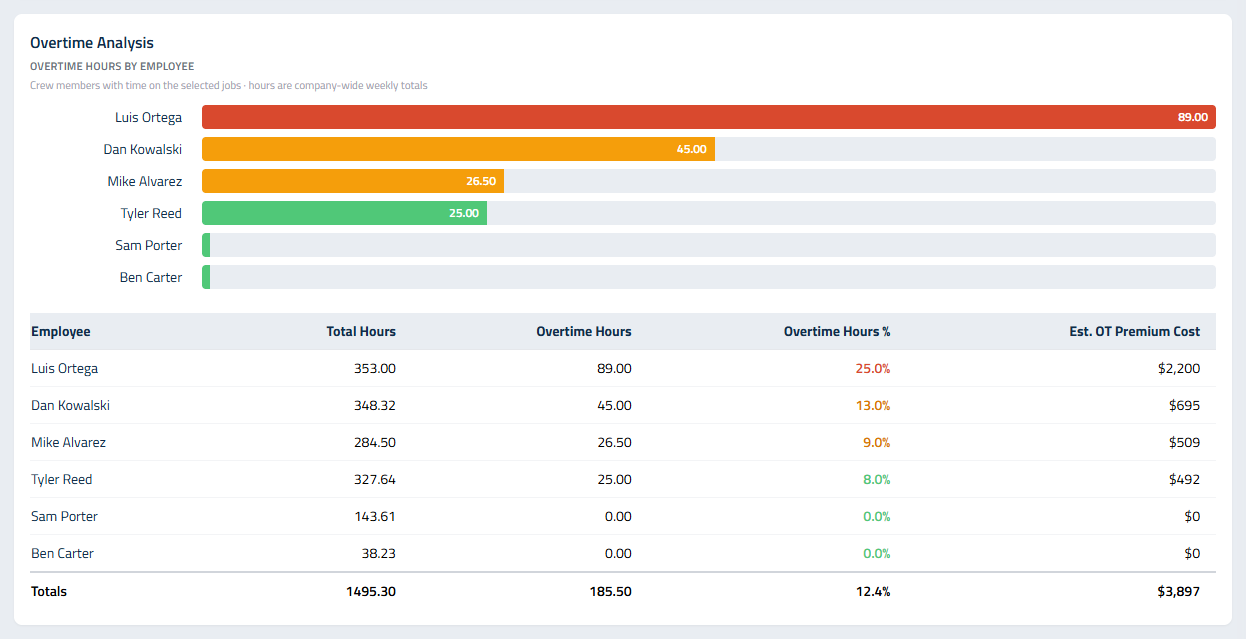
Overtime Hours By Employee shows who's carrying the overtime. The table under it has each person's Total Hours, Overtime Hours, Overtime Hours % and Est. OT Premium Cost, which is what the overtime cost on top of paying those hours at the normal rate. The last row totals everything.
Off-Site Clocking Flags
Clock-ins and clock-outs that happened a long way from the job.
- Follow Up (amber): more than half a mile away.
- Investigate (red): more than 5 miles away.
The job's location is taken from where your crew usually clocks in on that job, so a job needs at least two clock-ins before anything can be flagged.
The table shows the Date, Time, Employee, Crew, Client, whether it was a clock In/Out, Miles from Project and the Action. "Review recommended with" at the top names the people with the most flags. Click a row to open a map showing the job and where the person actually clocked, with a link to directions in Google Maps.
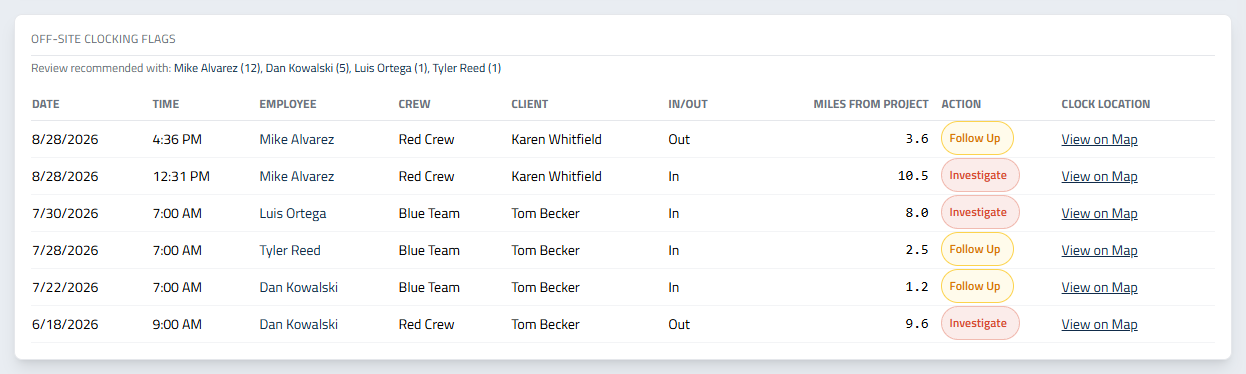
A flag isn't proof of anything. A supply run or a lunch stop can trip it. Use the map to decide whether it's worth a conversation.
Exports
- Export Projects downloads the jobs that match your filters, with price, Daily PMM, gross profit, budget and actual hours, hours over, overtime and labor overage.
- Export Employees downloads your whole team with each person's group, contract, hourly rate, loaded rate and overtime rate. Treat it like payroll; it has everyone's pay rates.
Getting Numbers You Can Trust
- Have crews clock in to the job, not only the day.
- Make sure finished jobs are marked complete. Most of this page only counts completed jobs.
- Keep each employee's rates up to date in Profit Genie, so labor costs are right.
Updated on: 09/29/2026
Thank you!